Moon or Doom: XRP Market Flips Bearish—Is It Over?
- August 21, 2025
- Category:

What a difference a week has made for XRP .
Just last week, it looked like the stars were aligning for members of the XRP Army. The Ripple-linked token had just come off an all-time high price of $3.65—a record that had stood for eight long years—and the bullish vibes were back. Now? Not so much.
On Myriad , a prediction market created by Decrypt ’s parent company Dastan, users last week placed the odds of XRP hitting $4 at 66%. Fast forward to today, and those odds have collapsed to a coin flip: 51% for the “moon” scenario of $4, and 49% for the “doom” outcome of $2. Those odds are slightly better than they were yesterday when bears had decisively flipped the mood and priced the $2 scenario at 61%. Either way, it’s a fairly stunning reversal in sentiment.
What explains the change? Let’s take a look at the charts:
XRP price: A breakdown that changes everything
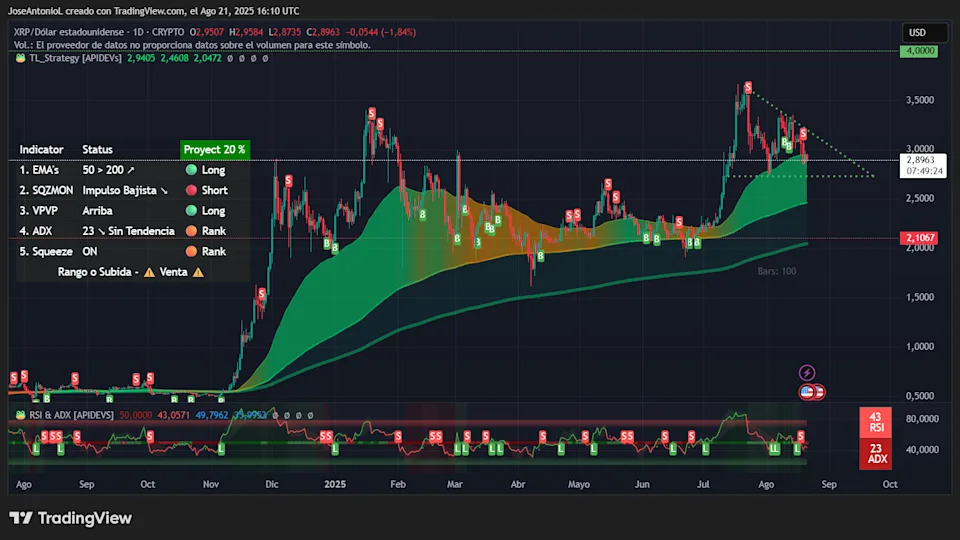
XRP price action today tells the story. The coin opened at $2.9507, tried to break past the psychologically significant $3 level, then rolled over hard to hit lows of $2.8735. It has since settled to around $2.8963. That's a 1.84% decline that makes things hard for the moon boys who only want number to go up forever.
Looking at the daily chart, the price of XRP has done something that many traders would find alarming: the current price has broken below the average price of the last 50 days. Exponential moving averages, or EMAs, provide traders with a gauge of where price supports and resistances are among buyers and sellers. While falling below the 50-day EMA might not be enough to trigger algorithmic sales, Myriad users have something to consider here.
If the XRP market starts treating the 50-day EMA as a resistance, even in an overall bullish trend, it could become increasingly difficult for bulls to break past the $3.00 price mark and reach the $4 “moon” target. On the other hand, $2 is still below the 200-day EMA, which means XRP would need heavy bearish momentum to hit that mark. But such momentum isn’t out of the question, especially considering “red September” is coming and it’s been only down ever since XRP notched its all-time high in mid-July.
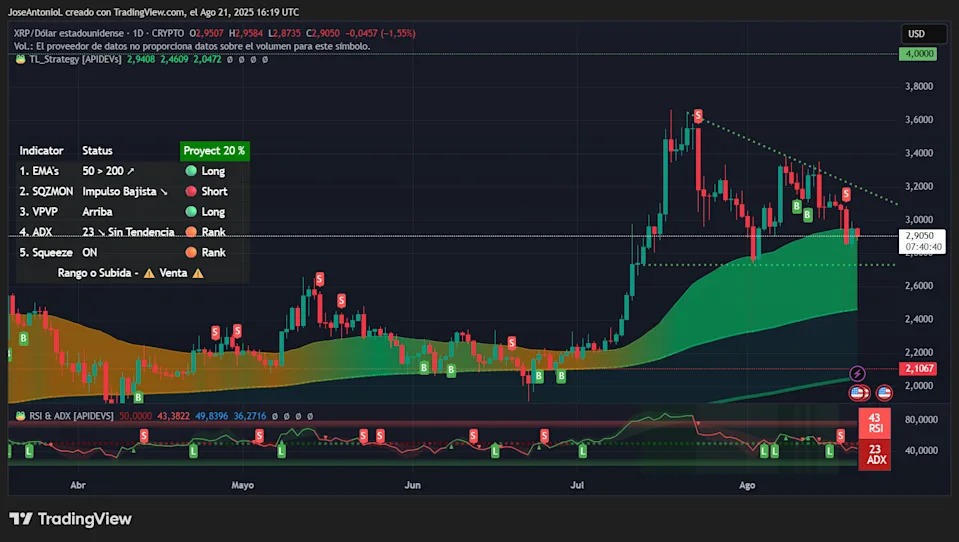
What’s more, XRP’s Relative Strength Index, or RSI, has plummeted to 43, well below the neutral 50 level. RSI measures momentum on a 0-100 scale, and readings below 45 often signal that sellers have taken control. This isn't just a minor dip below 50. At 43, we're seeing genuine bearish momentum building. Given other variables, traders could easily interpret an RSI below 45 as a warning of more downside to come unless buyers step in aggressively.