Apple (AAPL) Recovers 50% from Recent Deep
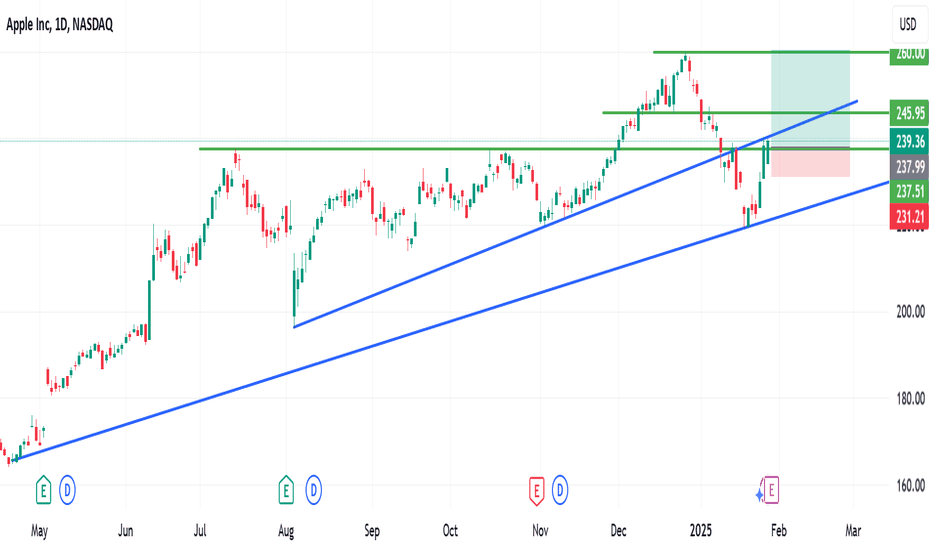
Apple (AAPL) Recovers 50% from Recent Decline – Technical Outlook & Forecast Apple Inc. (AAPL) has made a strong recovery after experiencing a sharp decline earlier this month. The downturn, which affected several major U.S. tech stocks, was largely triggered by the release of China’s AI model, DeepSeek, on the 21st. However, the broader market has since rebounded, regaining much of the lost ground. Technical Analysis AAPL is currently trading at a key technical level, the 50% Fibonacci retracement of its recent decline. This indicates a partial recovery from the previous drop, positioning the stock at a potential decision point for traders. Support Level: $231 Resistance Level: $260 Current Price Area: Near 50% Fibonacci retracement Trade Plan Given the recent recovery, I anticipate a potential pullback before further upward movement. My strategy is as follows: Entry: Waiting for a pullback to $237 Stop Loss (SL): $231 to limit downside risk Take Profit 1 (TP1): $260, aligning with resistance levels Conclusion AAPL's recovery from its recent dip suggests strong buying interest. However, market volatility remains a factor, so careful risk management is essential. Trade with caution and follow your risk strategy.
Read More

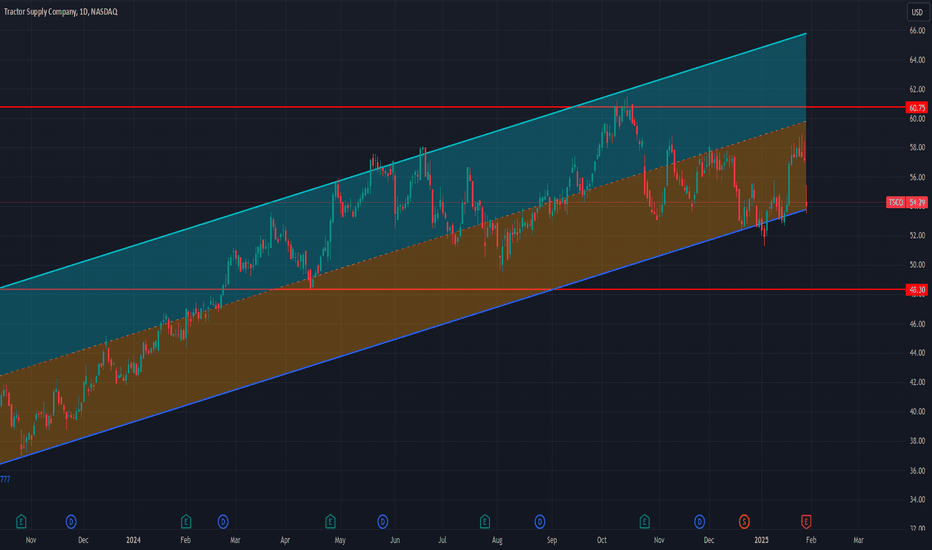
TSCO supplies LARGE gains for me - LONG at 54.29
TSCO may not be an obvious choice for the kind of short term trading I do, but that doesn’t stop it from being literally one of the 5 best stocks (historically) for my trading system. In backtests and live trades, it has a record of 892-1. The average gain on those trades was +2.6% in an average of 11 trading days for an average daily return of almost 6x that of the S&P. Both of those are very good numbers compared to the universe of over 2000 stocks I screen. Additionally, it produces low drawdowns with my system (all time max of 7.7%) and its max allocation of capital was 10 lots, less than half of the average stock in my universe. Basically, it produces outsized daily returns, with much smaller than average capital usage and small drawdowns. That's EXACTLY what this system is aiming for. It would not surprise me, though, if it had a couple more down days first. When stocks gap down on earnings, that's usually not a 1 day thing. But while the setup here is not ideal, I'll take that chance, considering its outlandishly good returns over time. Like in poker or blackjack, there's always a chance for a bad beat, but the odds are decidedly in my favor here. It has also had some semi-unpleasantly long trades of late, but even if this trade produces half the normal return AND takes twice as long to pay off, it's still a far better return than the average return of the market. There is plenty of near term support from the regression channel bottom as well as recent lows at 55.10 and 51.93 too. Here's hoping TSCO pulls some profits my way and does so quickly. Per my usual strategy, I'll add to my position at the close on any day it still rates as a “buy” and I will use FPC (first profitable close) to exit any lot on the day it closes at any profit. As always - this is intended as "edutainment" and my perspective on what I am or would be doing, not a recommendation for you to buy or sell. Act accordingly and invest at your own risk. DYOR and only make investments that make good financial sense for you in your current situation.
Read More
Opening (IRA): UPS June 20th 90C/March 21st -115C
... for a 19.60 debit. Comments: Buying the back month 90 delta call and selling a front month that pays for at least all of the extrinsic in the long such that the break even is at or below where the stock is currently trading. Metrics: Buying Power Effect: 19.60 Break Even: 109.60/share Max Profit: 5.40 ROC at Max: 27.6% I generally look to take profit on these at 110% of what I put them on for and/or roll out the short call if my take profit isn't hit.
Read More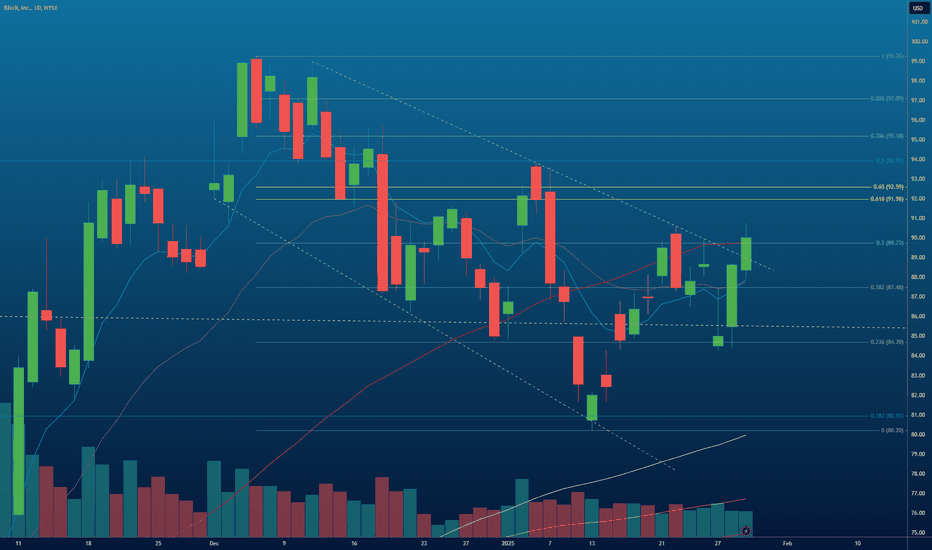
$SQ $XYZ Block Inc Wedge Break
- Wedge Break - D50sma break - D8&21ema reclaim - $91.00 key lOI for push to the GP
Read More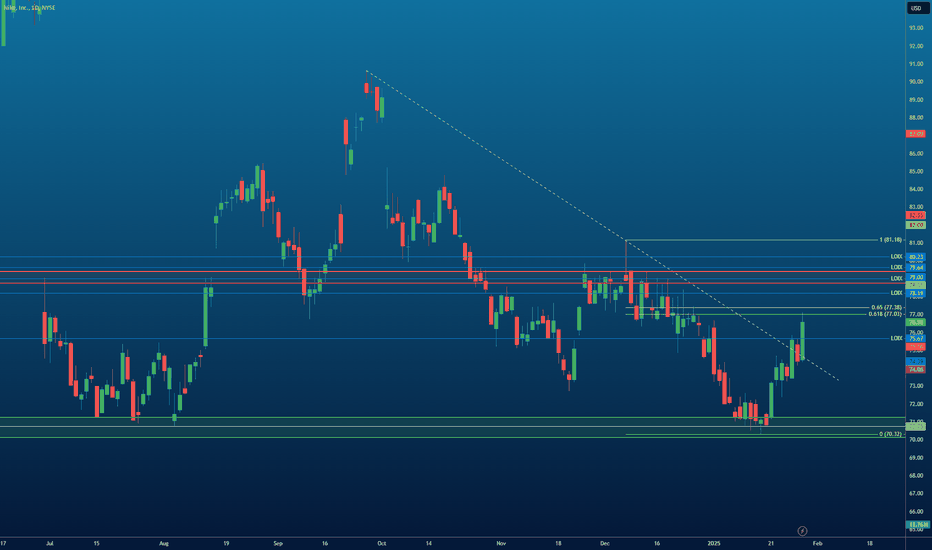
$NKE Nike Double Bottom Bounce Back to Fib GP
Alert set @$77.38 for Fib GP break Stock back inside the 2024 Candle Downtrend Break
Read More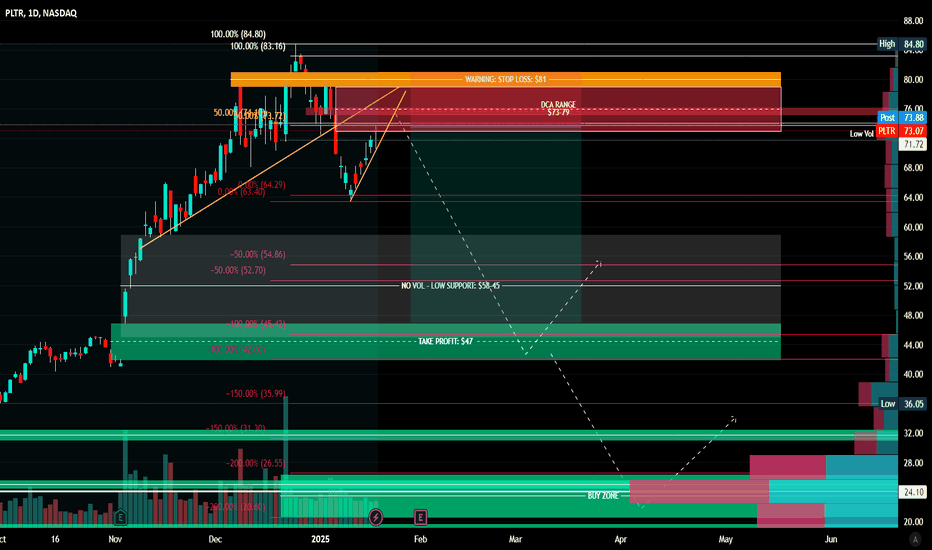
SHORT PLTR
PLTR Put Strategy Plan: 1. DCA INTO PUTS: Target the $74–$79 range for initiating put positions. Use a scaling approach to average down effectively as the price rises. 2. PUT CONTRACT SELECTION: Choose 2-3 month expiration puts (e.g., February/March 2025). Strikes: $65 or $60 puts depending on risk appetite. 3. POSITION SIZING: Start small and scale up with each $1 increase in stock price: Example: 1 contract at $74 2 contracts at $75 4 contracts at $76, and so on. This ensures a meaningful average entry without over-allocating capital too quickly. 4. TARGETS: Short-term Target: $58.45 (first exit zone). Long-term Target: $47 (max profit potential). 5. STOP LOSS: Limit your loss by closing positions if PLTR breaks above $81. Alternatively, cap your total risk at 5% of your portfolio size and avoid adding contracts above your risk tolerance.
Read More

Dogecoin Flips XRP as Elon Musk-Linked Trade Keeps on Giving
DOGE prices zoomed a further 14% on Sunday, pushing the token above XRP to make …
Read More