'Rich Dad Poor Dad' Author Kiyosaki Reveals His Plan to Get Rich Amid Global Crash
U.Today - The wheels of a global financial crash, says Robert Kiyosaki, are already in motion. It is no longer distant speculation but, as he describes, a reality unfolding across...
Read More
Microstrategy, Inc. Sold 1.32M Shares via ATM, Bought 5,262 BTC
(Updated - December 23, 2024 8:51 AM EST) As previously disclosed, on October 30, 2024, Microstrategy, Inc. (NASDAQ:MSTR) entered into a Sales Agreement (the “Sales Agreement”)...
Read More
Stocks Slip Before the Open as Middle East Tensions Rise, U.S. Economic Data on Tap
Switch the Market flag for targeted data from your country of choice. Open the menu …
Read More
Australia's Police Confiscates Crypto Worth $6.4M in Crackdown on 'Ghost' Messaging App
Australia’s police has confiscated $6.4 million in cryptocurrency as part of a global crackdown on …
Read More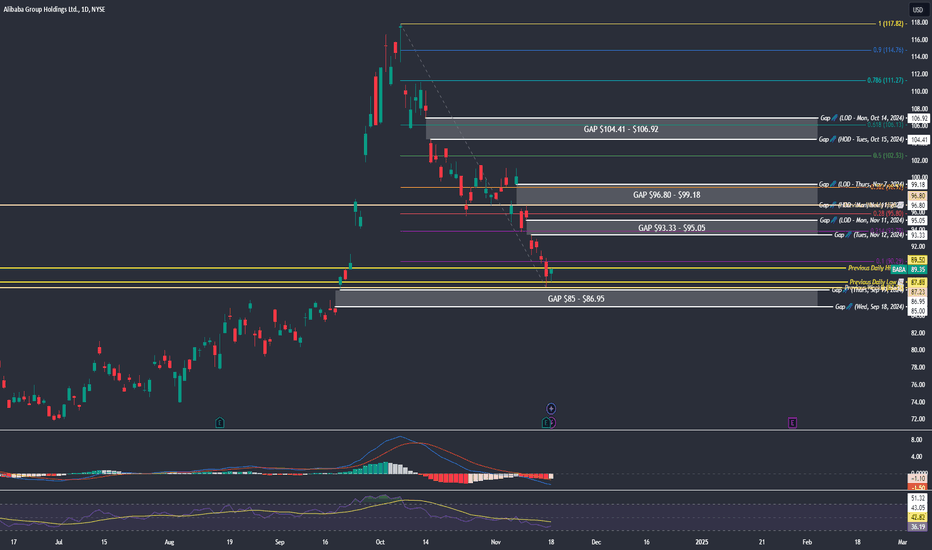
Alibaba: Will $BABA Bounce Back or Break Key Support (Daily TF)
Hey everyone, below is an analysis on NYSE:BABA using MACD, RSI, Fibonacci levels and technical (gap) levels. Current Price Levels: NYSE:BABA is trading around $89.35, down significantly (~26%) from its October 7 high of $117.82. A notable gap between $85 and $86.95 suggests this is a key level of interest for potential support or further downside risk. Momentum Indicators: MACD: Shows signs of curling upward, which could indicate momentum shifting toward bullish sentiment. RSI: Currently not oversold (at 36), but still in a relatively low range, suggesting there is room for price recovery. Technical Levels: Gaps and Fibonacci retracements are marked as potential resistance and support zones: Gap resistance levels: $93.33-$95.05 and $96.80-$99.18. Higher resistance levels around $104.41 (gap from October 15) and $117.82 (October high). Previous daily high at $89.50 could act as near-term resistance. Fibonacci Levels: The chart includes a retracement from the October high ($117.82) to recent lows, with levels such as 0.236 ($90.29), 0.5 ($102.53), and 0.786 ($111.27) potentially serving as resistance on any upward move. Feedback and Outlook: Support and Resistance Analysis: Support: The gap zone between $85-$86.95 may provide a strong base if selling pressure continues. A break below $85 could indicate further downside. Resistance: Short-term resistance is seen at $90.29 (0.236 Fib level) and $93.33-$95.05 (gap resistance). These levels will likely be tested if buying pressure builds. Gaps to Be Filled: If the price begins to recover, the first upside target would be filling the $93.33-$95.05 gap. This aligns with Fibonacci retracement levels and may act as strong resistance. Outlook: Bullish Case: If momentum continues to build, expect a recovery toward the $93-$95 range, with further potential to reach $102 (50% retracement). This would require breaking above immediate resistance at $90.29. Bearish Case: If the current support at $85 fails, further downside to test levels around $80 or lower is possible. Final Thoughts: The chart suggests a cautious bullish outlook in the short term, especially if the $85 support holds. Watch for price action and volume around the resistance zones to confirm whether this is a dead-cat bounce or a true reversal. Currently in NYSE:BABA 1/17/25 $100c (BOT @ $1.73).
Read More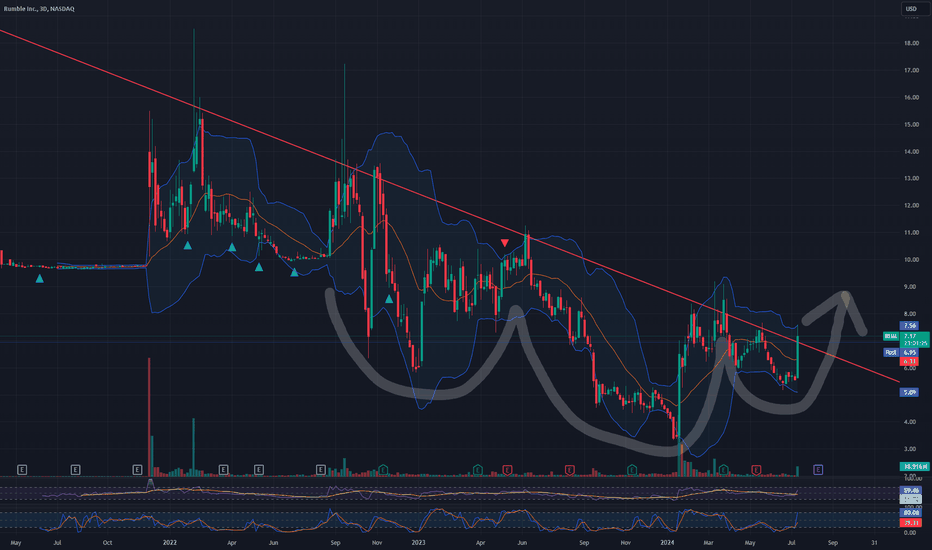
Yo ho ho and a #BottledUp $RUM (Post IPO Phase Base?)
Is this break out real? Paytience Pays as noted with SMCI today... I do like the "somewhat" inverse head n shoulder base, but its definitely not NEAR as clean as the CVNA Post IPO Phase Base seen here; This can be a "sympathy" play ie; highly correlated movement, with $DJT... I like this look with the hype currently building... Great things take time... Don't get chopped to bits before the real move/meat comes. Just some post boring market day #Thots
Read More
US crypto industry eyes possible day-one Trump executive orders
By Hannah Lang (Reuters) - The cryptocurrency industry is pushing President-elect Donald Trump's team to kick start his promised crypto policy overhaul when he takes office next...
Read More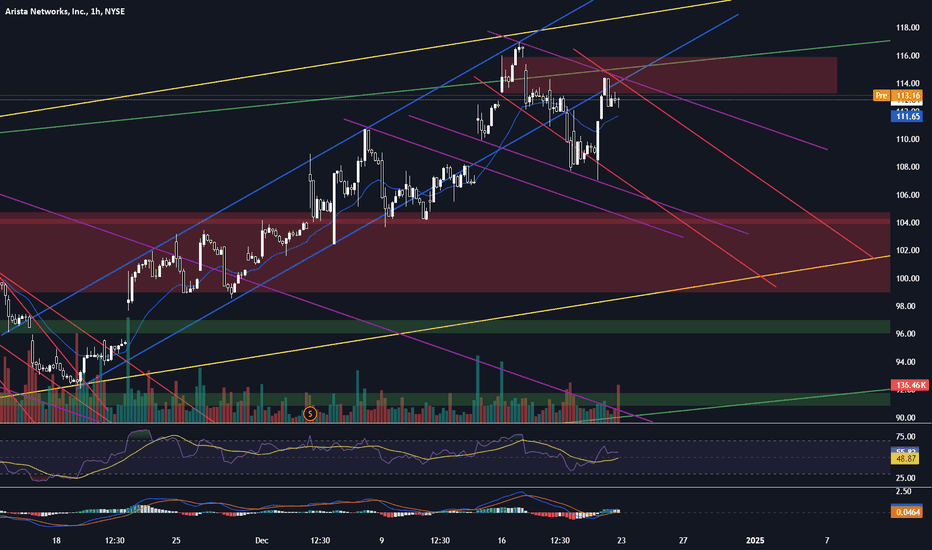
ANET - Eyeing a short-term short on a very bullish chart
Video says it all. If we see the confluences that we need to, I will enter a position, if not - not! That's the way the trading game works - set your plan and stick to it. Happy Trading :)
Read More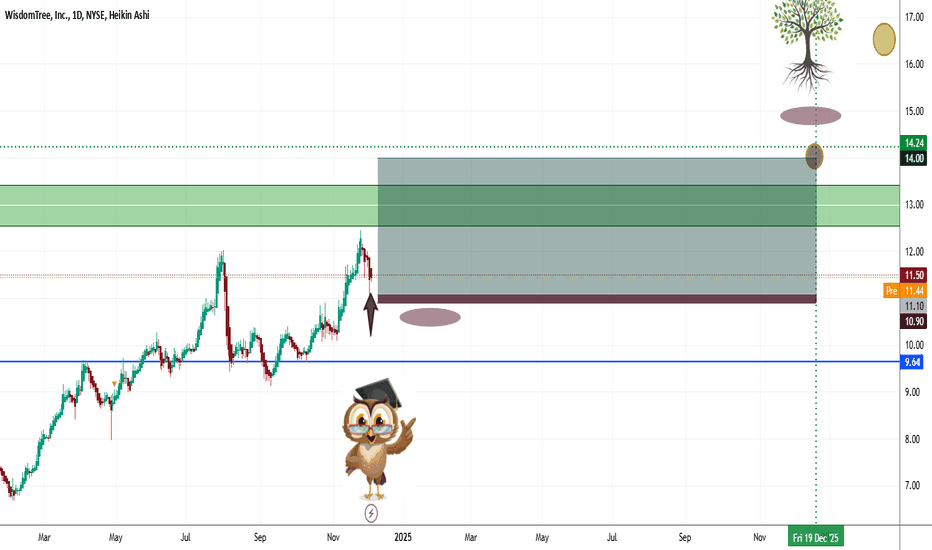
"Trust The Wisdom "
"Picture me, the Talking Tree, branching out into the world of finance! I made like a squirrel and went long on some stocks - figured I'd grow my portfolio like a sturdy oak. If the market keeps climbing, I'll be swinging from the branches with joy. If not, well, I'll just leaf it to fate and hope for some sunny days ahead!"
Read More
BingX Provides Free SEPA & SEPA Instant Euro Deposit Service to Users
Vilnius, Lithuania, December 23rd, 2024, Chainwire BingX, a global leading cryptocurrency exchange, has expanded its fiat deposit options with the launch of the SEPA and SEPA...
Read More
Oura Ring 4 smart ring announced for $349, releases Oct. 15
A user wearing an Oura Ring Courtesy: Oura Oura unveiled its new smart ring, the …
Read More
Ethereum FUD returns as ICO whale offloads another $47M
Ethereum fear, uncertainty, and doubt are seemingly seeping back into the market as Ether prices …
Read More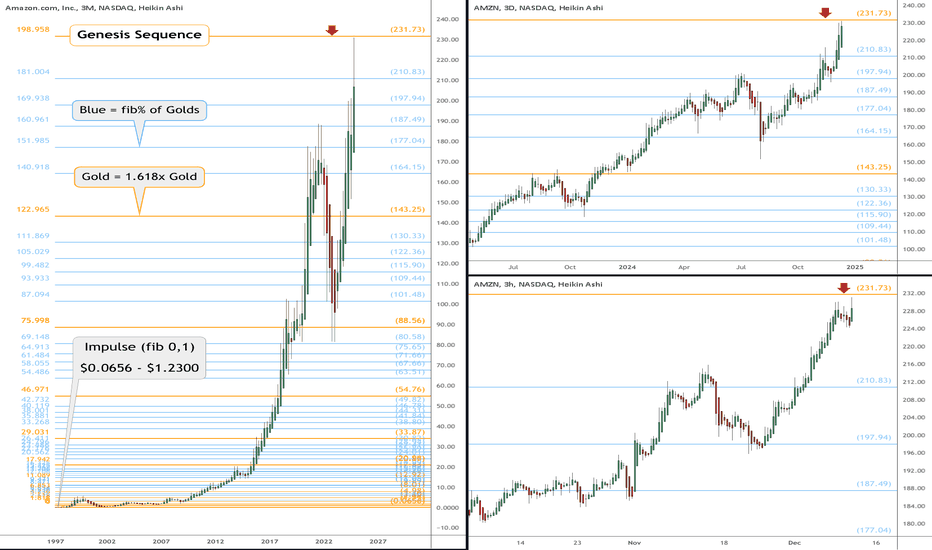
AMZN watch $231.73: Golden Genesis fib to mark a top and dip?
Show here is a single fib series in three different time-frames. "Genesis Sequence" is the DNA and growth pattern from birth. The "Golden" multiples are always the strongest fibs to watch. It is PROBABLE that we see a pullback here. It is POSSIBLE that it be a significant TOP. It is PLAUSIBLE that it breaks and retests. =======================================================
Read More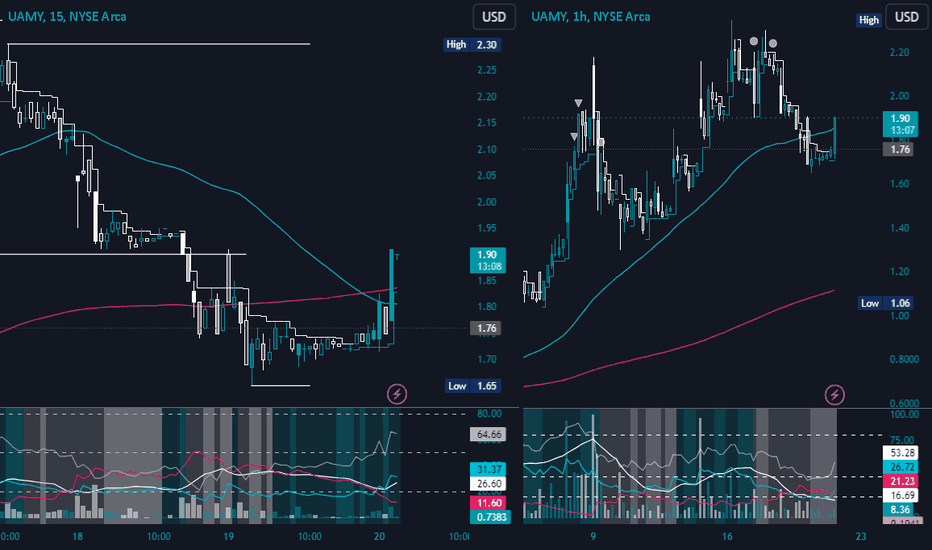
UAMY Ready for Another Run Up
I believe UAMY is ready for another run up now. According to SimplyWall.St, UAMY earnings are forecast to grow 158.07% per year and has had a very volitile past months compared to the US market. SimplyWall.St is a website I just discovered yesterday and I am glad to share it with everyone. It has a lot on a stocks fundamentals, going over risks and rewards, is very user friendly, and more importantly, is FREE. simplywall.st
Read More
Is the Bullish Momentum Fading?
Este artículo también está disponible en español. Ethereum price extended its decline below the $2,450 …
Read More