Massive 400 Billion SHIB From Early Whale Stuns Major US Exchange
U.Today - According to analytics X account @Spotonchain, earlier today, two staggering amounts of Shiba Inu meme coins were sold. This has happened as the second most popular in...
Read More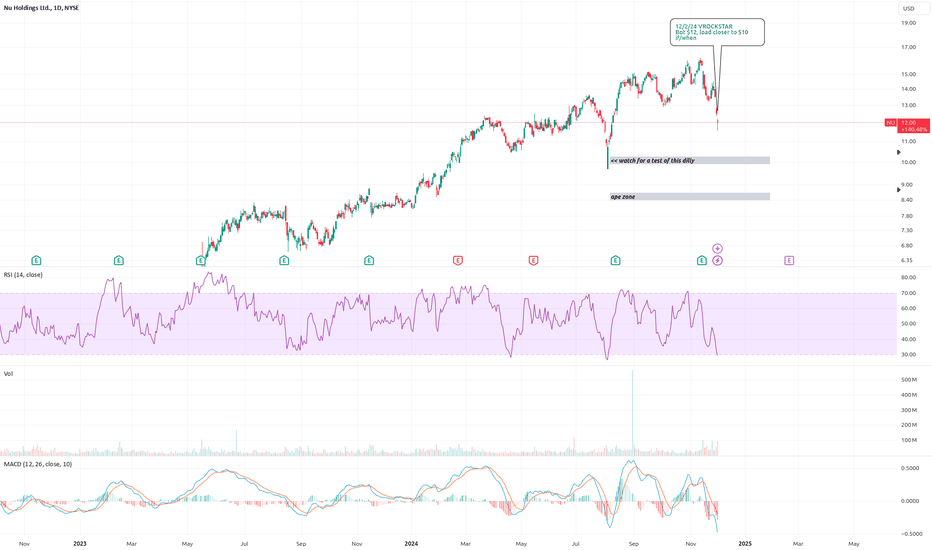
12/2/24 - $nu - Bot $12, load closer to $10 if/when (LONG)
12/2/24 :: VROCKSTAR :: NYSE:NU Bot $12, load closer to $10 if/when - is one of the three stonks in latam that i've commented in the past is worth keeping a v close eye on b/c of the growth rates and tremendous product. the others are NASDAQ:MELI and NASDAQ:DLO (the latter of which worked out nicely and we made a good exit earlier this year from the lows, but it took a minute). - back to Nubank: 1/ brazil in earlier innings of economic funeral, but what's new this happens every so often and those battle tested growers tend to come out of these events eating massive share, Nu will be one of these 2/ timing is always the tricky thing. you want to take calculated risk, but unlike the US stonks, you have clear geo/ FX and therefore adverse flows risk to consider. invest in emerging mkts and you need to have a tolerance/ knowledge of currency risk, minimally. i'm not going to downplay that here, but only to flag this needs to be something you consider if/when considering a stake in $nu. the counter point is they're growing bananas outside of Brazil as well and likely take over pretty much over every other latam country similar to Meli. IMO, there's no competition for the growth engine they can export into latam. 3/ let's math and use two approaches... PE and ROE -> book value a1. PE: let's imagine the 62c next year (in USD) is 50c - only a 15% growth. the reason you'd look at this is b/c most investors r going to be focused here, so you stand the chance of risk-evaluating what others see and making a call (similar to support and resistance vs. some esoteric TA you've developed). in this vein, what would you pay for a 15% EPS grower (ignoring all other factors of what this biz is and only considering it's a bank in Latam)? maybe 10-12x? def sub 1x PEG. b/c it's brazil, brazil is currently fukt. so you put a "depressed multiple" on a depressed EPS. at call it 50c and 10x - you're at $5 bucks. sick downside from the $12 it closed at today. so that's probably *worst* case, from today's POV. let's call that -60%. diddy slip and slide party pain. a.2: PE: but this isn't some "new kid on the block". a lot of Nu investors are smart int'l types that are going to look beyond trough '25, even today, including papi warren B. so if we assume we pick up from 15% toward 20% the following year and go 50c -> 60c, you'd probably start to consider at that point at least a PEG of 1x given growth would extend to the following yrs as well. at 20x on 60c you're at $12 for year-end '26. and let's give it a 15% discount (Ke brazil finger in air - but likely in the ballpark) and you get to $10 and change for the 12M view e.g. YE25, which is the bogey we're all looking at today given we're already done w/ '24. so that's 20% downside. combining a.1 and a.2 above... i'd likely weight a.2 as being perhaps a 70% and a.1 as 30% given the logic described, investor base and this isn't some going concern issue. also i'm being mega conservative w/ my EPS estimates as well. if you haven't noticed, they keep ripping the cover off the ball on EPS. so combined that's -60%*30% + -20%*70% = 33% downside more or less or a $8 stonk. b: ROE thinking. 25% ROEs (probably expanding) and growing book at probably ~$1/shr for the next 2 yrs combined gets you to a book of $5. when you consider this likely continues to grow nearly 15-20% a year... and we could be conservative and say it's 10% a year (cut it more than in half)... at a 15% Ke you get: Price = BookVal * (ROE - g)/(Ke - g) then discount 2 yrs by 15%. this is Price = $5 * (25 - 10)/(15 - 10)/1.15/1.15 = $11+ today. tying this all together... fair value is probably between 10 and 11 today. so buying $12 is defn being a bit opportunistic and playing a reversion move on BRL related assets. i'd not be surprised to see this thing move back toward $13/14 into year end, and equally i'd not be surprised to see it test the big green dilly from Aug 5 this year that ripped thru $10. So, it's not an obvious trade for those who don't know this asset or haven't been following that closely. perhaps easier to wait for better entry even if that means some chop here/ there and you get a bit of fomo if first move is up. The way i'm personally playing it are $10 and $11 strike 2027 leaps. allows me to amp my exposure without necking out too hard on a notional cash-in basis. offers about 3-1 leverage, so a 1.5-2% options position gets me a gross effective of about 5-6%. that's comfy for now. i'd like to get this position closer to 10-15% if/when we hit the $10s area or below (and it will be one to manage b/c *WHY* we go there will matter a lot - not just a rote plan, these things always evolve and perhaps there are other better deals out there too esp in the US or my favs NASDAQ:NXT , NYSE:TSM , NASDAQ:META ). anyway. wanted to flag. should be on your radar. this is a quality LT compounder that's gotten cheap b/c of geography, but is a neo-bank virus to the existing dino's in latam. LMK what u think or esp if u see it differently. have a good week my friends V
Read More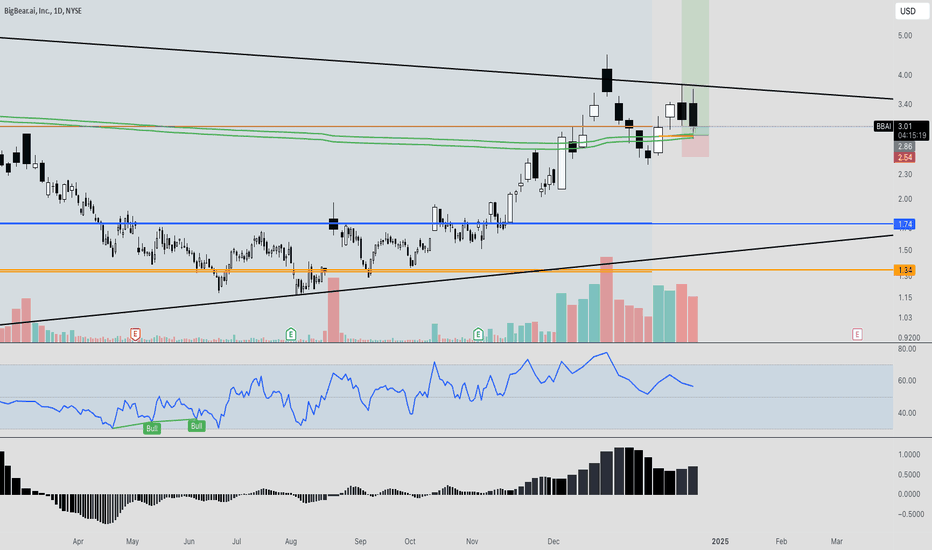
BBAI: The Next Big AI Stock
The AI industry has captured alot of interest from many investors and traders alike. After the most recent massive rally on Sounhound , for a whopping 400% , we may potentially see a rotation into other AI players such as Big Bear. BigBear.ai is a technology and analytics company specializing in artificial intelligence (AI) solutions for decision support and predictive analytics. The company focuses on providing AI-driven tools and insights to support data-driven decision-making, particularly in complex and high-stakes environments. BigBear.ai serves industries such as defense, healthcare, manufacturing, and logistics, offering services that include: Predictive Analytics: Helping organizations anticipate future scenarios by analyzing patterns and trends. Data Integration: Combining data from multiple sources for a unified and actionable perspective. AI-Driven Decision Support: Leveraging machine learning and advanced algorithms to guide strategic planning. Simulation and Modeling: Creating virtual scenarios to test outcomes and optimize decision-making. The company's solutions are designed to enhance operational efficiency, improve situational awareness, and enable smarter, faster decisions. At the moment, we have several indicators pointing to potentially higher prices including the anchored vwap of the low, as well as a value area breakout and massive triangle breakout. Lets see how it plays out
Read More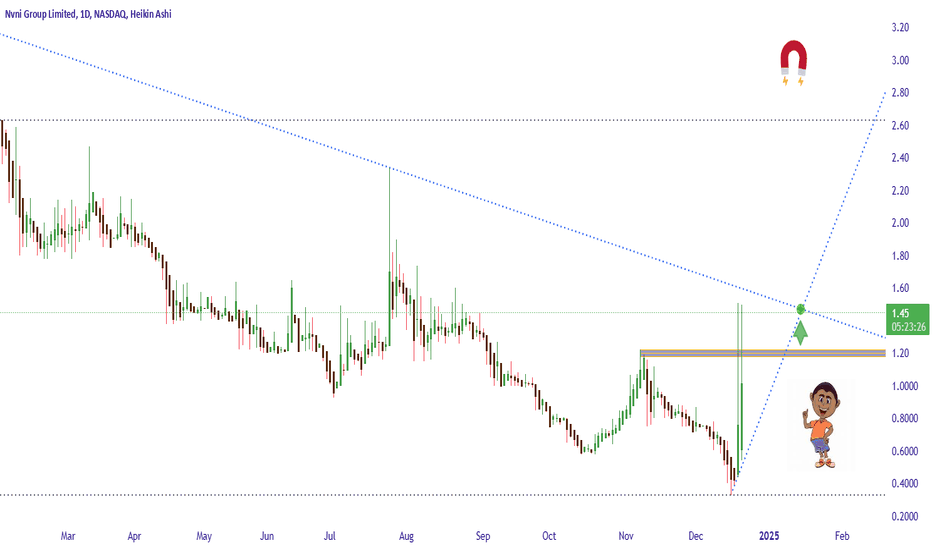
"Surfing the NVNI Tsunami"
NVNI is a rollercoaster ride for thrill-seekers. This high-volatility ticker can deliver explosive short-term moves, perfect for traders who love adrenaline-fueled opportunities. Ride the waves, time the dips, and cash out before the tide turns!
Read More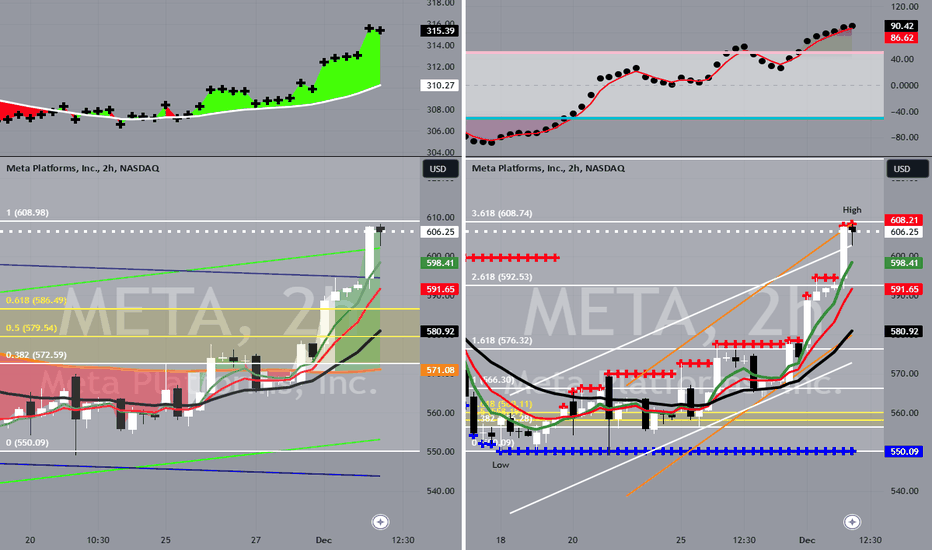
META pullback to $586
MODs have suggested that I provide more detail about the picks I make. Sorry. I'm not as verbose as y'all, and I don't like things to be complicated. My trading plan is very simple. I buy or sell at top & bottom of parallel channels. I confirm when price hits Fibonacci levels. So... Here's why I'm picking this symbol to do the thing. 2HR CHART (expect target to hit THIS WEEK) Price at or above top of channels (period 100 52 39 & 26) Stochastic Momentum Index (SMI) at overbought level VBSM is spiked positive Price at or near 3.618 Fibonacci level Target is $586 or channel bottom
Read More
Mantle Network Advances Technical Roadmap As The First ZK Validity Rollup with Succinct’s SP1
Singapore, Singapore, December 19th, 2024, Chainwire Succinct alliance establishes Mantle Network as highest-TVL ZK validity rollup Mantle Network, an Ethereum layer 2 (L2) known...
Read More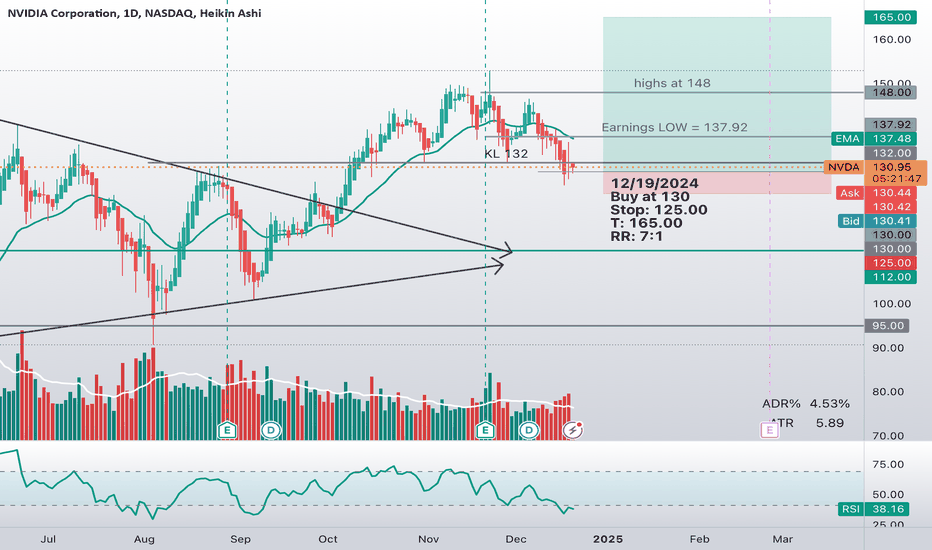
NVDA is coming back
Went below the earnings low but the stock has a strong support around 127 and 132 range. Relative strength is pretty good and it seems like is trying to come back. The fundamentals are still good. Therefore, I have this trade idea to buy the stock of the 130 with a very tight stop at 125 and my target is 165.
Read More
Marinade Finance Makes Strategic Investment in SuperSol
Dubai, United Arab Emirates, December 19th, 2024, Chainwire Marinade Finance Makes Strategic Investment in SuperSol to Boost Solana’s Growth and Enhance Layer-2...
Read More
SIDUS HEROES Expands Blockchain Gaming Ecosystem with Immersive Metaverse and Strategic Gameplay
Dubai, UAE, December 19th, 2024, Chainwire SIDUS HEROES is revolutionizing the blockchain gaming industry with its expansive space-themed metaverse ecosystem, designed to provide...
Read More
Deus Wallet Introduces Duress Mode: The Revolutionary Solution for Cryptocurrency Security
London, UK, December 19th, 2024, Chainwire As cryptocurrency adoption expands, so do the associated risks, including physical threats targeting crypto holders. Traditional wallets...
Read More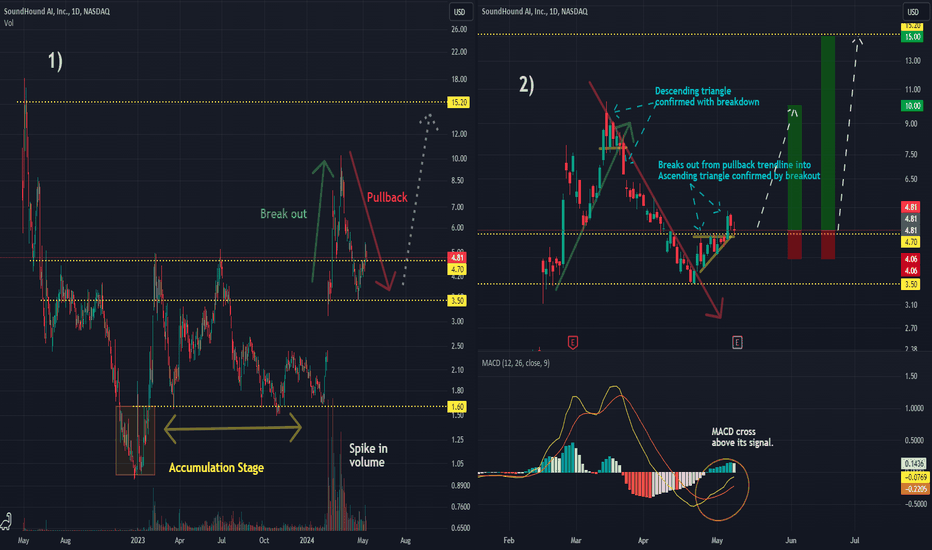
Technical Analysis of Stock SOUN 5/8/2024
Technical Analysis of Stock SOUN Introduction: SOUN, founded by a computer scientist from the dot-com era, has garnered significant attention from investors, including heavyweights like NVDA and Kleiner Perkins. Notably, Kleiner Perkins' backing is a considerable endorsement. The company's innovations, such as AI-powered burger ordering at White Castle, underscore its potential in the market. Daily Chart Technical Analysis: Overview: This analysis delves into both the broader picture and recent price movements of Stock SOUN Daily Chart #1: This chart illustrates the complete price history of Stock SOUN, revealing its trajectory since going public in April 2022. After an initial crash to $1 by the end of 2022, the stock traded sideways between $1.60 and $4.70 from January 2023 to February 2024. During this period, it struggled to breach the resistance zone of $3.50 to $4.70. However, by the end of February 2024, a surge in trading volume facilitated a breakout, with the stock reaching a high of $10.25. Subsequently, there was a significant pullback of -65%, bringing the price back to the $3.50 to $4.70 resistance zone. Observations: This breakout from an accumulation stage, followed by a pullback to a historically resistant zone, presents a compelling opportunity. The confirmation of the breakout by massive trading volume adds further credibility. We will now assess if there is a viable entry point for a long position. Daily Chart #2: Here, we focus on the breakout and subsequent pullback to the $3.50 to $4.70 resistance zone. The breakout on February 26 led to a surge in prices to the $10 range. However, as the breakout reached its peak, a descending triangle formed, indicating an imminent pullback. This pullback retraced the price back to the $3.50 to $4.70 zone, where it found support and broke through the pullback trendline. The price is now attempting to establish the $3.50 to $4.70 zone as a support level, forming an ascending triangle. On May 6th, the price broke out from this triangle and above $4.70. Concurrently, the MACD crossed above its signal, signaling bullish conditions. Implications: The technical indicators suggest a favorable outlook, especially with earnings scheduled for May 9, 2024. These factors indicate potentially bullish earnings. Trade Strategy: Entry: $4.81 Stop Loss: $4.06 (-15.59%) Target #1: $10.00 (+107.90%) Target #2: $15.00 (+211.85%) - There's a possibility of exceeding this target; I'll trail if the price exhibits parabolic movement beyond $15.
Read More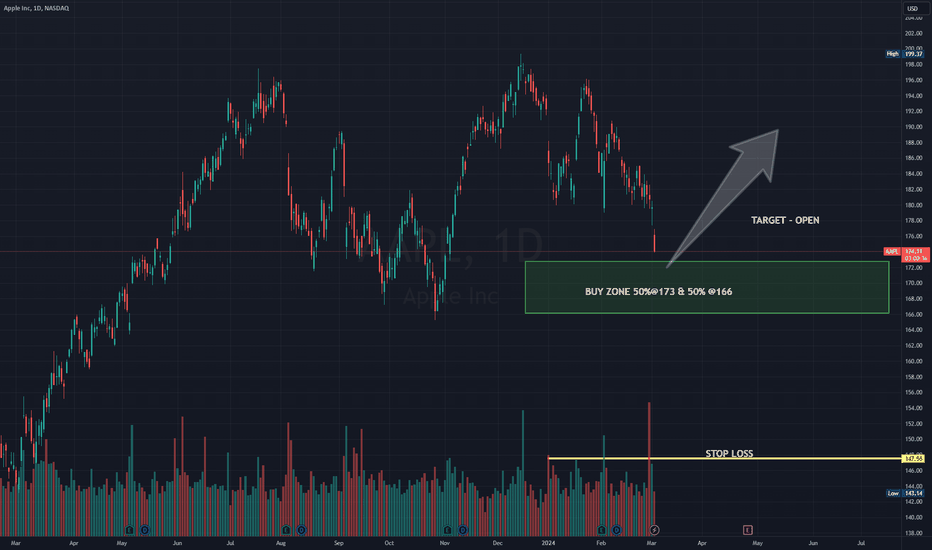
APPLE - EXCELLENT OPPORTUNITY
There is no trade recommendation. Just for study purposes. Level marked in the chart. Excellent opportunity in Apple - Add 50% at 173 and the remaining 50% at 166. Stop Loss - 1 % of portfolio.
Read More
Trump Leading Kamala Harris in Five Key Swing States
Former President Donald Trump is leading Vice President Kamala Harris in five key swing states, …
Read More
Bitcoin price today: drops to $101k on hawkish Fed, Powell comments
-- Bitcoin slipped on Thursday, retreating further from its recent peak as the U.S. Federal Reserve’s hawkish outlook raised concerns about tighter monetary conditions...
Read More
Bitcoin (BTC) New Year Rally Ended? Ethereum (ETH) Crucial Bearish Pattern, Dogecoin (DOGE): Down Even More
U.Today - Bitcoin's New Year rally has stalled, prompting concerns about whether the bullish momentum is weakening. According to the given chart, Bitcoin is currently trading at...
Read More